How To Read and Use a Retail Financial Statement
Put the Cause-Effect, Cause-Effect Power to Work in Your Retail Business
by Patricia M. Johnson, CMC and Richard F. Outcalt, CMC 
What did your last financial statement indicate to you about your business? If you say “It told me that we made a profit,” or “It’s just a year-end summary,” you would be wise to keep reading.
While a financial statement does provide that information, it is really much more. It provides vital clues to what’s right and wrong about your store. You don’t have to be a CPA to read one, just familiar with the basic accounting terms and what they mean to your business.
Here’s a review of the cause-effect basics.
The Balance Sheet
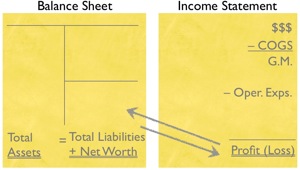
The information in a financial statement comes in two parts: the balance sheet and the income statement.
The balance sheet is a picture of the company at a specific moment in time.
It reflects various aspects of the health and strength of a business by listing its assets, liabilities and net worth (also referred to as equity).
Assets are the things owned by the company.
Assets can be broken down into two types: current assets and fixed assets.
Current assets are those that could easily be converted into cash within one year (such as cash itself, inventory and accounts receivable).
Fixed assets are things of a more permanent nature, that are not very easily converted into ready cash, like land, building, the company car, office equipment, leasehold improvements, furniture and fixtures.
Liabilities are the amounts owed by the company, or a listing of debts.
Current liabilities, as with current assets, are liabilities that will be due within one year (usually accounts payable, short-term notes payable, expenses you have incurred but not yet paid, the current portion of any long-term debt, etc.).
Long-term liabilities are liabilities that become due one year or more in the future (for example, the balance of any long-term debt not included in current liabilities).
Net Worth, or equity, shows how much of the business is actually owned outright by the owner(s).
A common entry found under net worth is retained earnings, which reflects the cumulative amount of previous profits and losses.
In The ROI's view, the balance sheet should be set up with assets on the left, and liabilities and net worth on the right. The first cardinal rule for the balance sheet is one that quite commonly is missed: The balance sheet must balance! Always!
It works the same way for a business that it does for a house.
For instance, let’s say you buy a house for $100,000, and it has a $60,000 mortgage. What is the equity in that house? Right, it’s $40,000.
How did you get that? You knew that the value of the house as an asset – the $100,000 – must equal the liabilities (or the mortgage, in this case) plus the equity. The mortgage is $60,000, therefore the equity must be $40,000, because the house as an asset is $100,000.
Now, let’s say you make some improvements to that house, and the value appreciates $20,000; the house is now worth $120,000, and $60,000 is in a mortgage. To pay for the work, you borrowed $7,500; thus, your liabilities increased from $60,000 to $67,500. How much is your net worth (equity) now?
That’s right, the equity would now be $52,500.
Here’s how we got that: The house is now worth $120,000; the $60,000 mortgage plus the $7,500 loan adds up to $67,500. Since total assets must equal total liabilities plus equity, $120,000 = $67,500 + equity. Therefore, we can calculate that equity is now $52,500.
The balance sheet in your business works just like the balance sheet for your house.
And remember, three things in life are certain: death, taxes, and...the balance sheet must balance!
Get MORE about profit management & growth
The Income Statement
The other essential part of your financial statement has a variety of names: the income statement, operating statement, profit and loss statement, P&L.
No matter what you call it, it summarizes activity over a period of time, usually one to 12 months.
The top entry on the income statement is Sales. This shows how many dollars you generated in sales (net of returns and excluding sales tax) over the given period of time.
The next entry down is cost of goods sold (COGS), which represents what the merchandise you reported under sales actually cost the company. (The basic formula for COGS is: beginning inventory plus purchases of inventory during the year minus the ending inventory. There are several different, accepted ways to figure cost of goods sold. Ask your bookkeeper or accountant which method they use to calculate your COGS.)
Once you subtract COGS from sales, the result is gross profit, also known as gross margin. This is the amount of margin dollars left after the cost of the merchandise is subtracted from your sales amount. But you can’t stop here.
The next series of entries on your income statement may range in type and number, depending on your size and tolerance for detail. These are your operating expenses.
With the advent of computers, operating expenses can be tracked in excruciating detail. Even worse, they often are shown on the income statement in an alphabetical list, such as “advertising”, “auto”, “bank charges”, etc. Yikes! This makes it very difficult to monitor and manage these expenses.
The ROI encourages you to create major groupings or categories for your expenses; we call them "buckets".
Here are the three we recommend: selling expenses; occupancy expenses; general and administrative expenses (sometimes referred to as G&A expenses). You then can first review expenses by category for comparison to prior performance and future projections, then go into the line item detail.
Selling expenses include all those expenses directly attributable to selling your merchandise. Salaries and commissions for sales associates, advertising, selling supplies, travel and entertainment, and portions of payroll taxes and benefits are all found in your selling expenses.
Occupancy expenses include things such as rent, utilities, equipment, maintenance—all those things that allow you to do business in your location.
General and Administrative expenses include administrative salaries, taxes and license fees, training, insurance, office supplies, etc.
When your operating expenses are totaled, they are subtracted from your gross margin to arrive at Net Profit.
Please, do not stop here! Net profit is only a number. It is not cash, you cannot write a check for it, and it certainly doesn’t pay your bills.
Where Does Profit Go? Who Gets It?
Since the balance sheet and income statement seem to represent two different aspects of a business, why are they always seen together?
Because that profit coming out the bottom of the income statement goes directly into retained earnings (under net worth) on your balance sheet.
Similarly, any losses on your income statement come directly out of your retained earnings.
This is an important – and powerful! – concept to understand.
The income statement and the balance sheet are inseparably linked.
There essentially is a pipe between the bottom line of your P&L (whether a profit or a loss) and retained earnings on your balance sheet.
And since the balance sheet always must balance, any increase or decrease to one side of your balance sheet must be offset on the other side of your balance sheet.
Let’s see how that works.
What To Do With A Profit
If you show a net profit on your income statement, where does it go? You have many choices (except the option not to balance).
Let’s say you end the month with a $20,000 net profit. It immediately goes from the bottom line of your P&L, through “the pipe”, into retained earnings on your balance sheet.
Since equity has increased by $20,000, assets must go up $20,00 or liabilities must go down $20,000, or some combination of both. The balance sheet must balance!
Let’s say you used that $20,000 to buy some inventory. Raise the inventory level by $20,000 under current assets. Does the balance sheet balance? Yes.
But what if you actually split the $20,000 between inventory and new carpeting? Raise the inventory by $10,000, and increase the leasehold improvements another $15,000. Does the balance sheet still balance?
No, not quite. Assets have increased +$25,000, but net worth has increased only $20,000. That means your liabilities must increase an additional $5,000 for the carpet. Now does the balance sheet balance?
Yes. We raised total assets by $25,000, total liabilities by $5,000 and net worth by $20,000. The increase in total assets (+$25,000) still equals the increase in total liabilities (+$5,000) plus net worth (+$20,000).
What To Do With A Loss
What if you had a loss instead of a profit? Which part of your business did the loss affect?
First, it came out of your retained earnings. But what else was affected?
Did it lower your inventory?
Did it increase your liabilities?
Adjust your balance sheet, but be sure to make the adjustments to each side so that the balance sheet still balances.
Knowledge Is Power!
Understanding this cause-effect, cause-effect relationship between the income statement and the balance sheet, and how the balance sheet must balance, is a powerful concept for retail owners!
Now, you can drive your business from the balance sheet.
And, if you're like most retail owners, that will mean a much greater sense of control. And – much more peace of mind!
©Copyright, The Retail Owners Institute® and Outcalt & Johnson: Retail Strategists, LLC.